


The National Women’s Law Center fights for gender justice—in the courts, in public policy, and in our society.
My School District Over-Punishes Girls of Color. Does Yours?

My School District Over-Punishes Girls of Color. Does Yours?
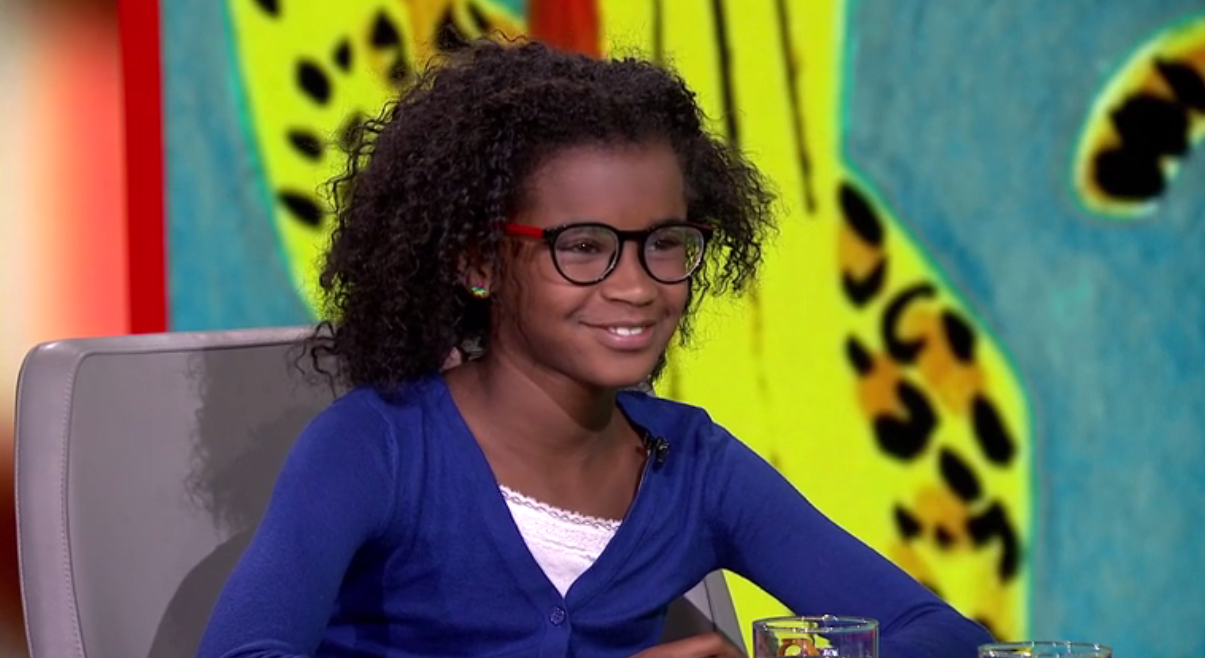
 I was born and raised in San Bernardino County, California, where my family could afford housing in a suburban area. We were lucky to live several blocks from a few schools, so education was a staple of my young life. Life was simple back then, or so I thought.
My school district was notorious for cracking down on students through suspension, which I now know is nothing to be proud of. For girls of color especially, being suspended for small things like dress code violations or chewing gum was all too common for us. I thought campus security intruding during class and escorting students out was normal, but wow, I was wrong! Our discipline policy was three-strikes and you’re out. When you were sent home for something so minor, the next small “offense” would lead to even harsher punishment – including suspension. It was even worse for my Black friends, who faced negative stereotypes that led teachers to label and punish them for having “attitude problems.” Now it’s totally clear to me that girls of color in my school were being hurt because of unfair discipline policies.
As we pledge to Let Her Learn, we must recognize that girls of color across the country are disproportionately suspended from school compared to their white peers. Suspensions cost kids valuable learning time, so when girls of color are suspended at such alarming and disproportionate rates, it means they have fewer opportunities to learn than their white peers. That’s why NWLC mapped out suspension rates of girls of color district by district.
Naturally, I was curious to see how my old school district stacked up.
In my school district, Colton Joint Unified, I discovered that 12.8% of Native Hawaiian/Pacific Islander girls like myself have been given an out-of-school suspension, compared to 1.1% of white girls. Since we’re only .3% of students enrolled in this district, yet we receive 2.6% of suspensions, that means Native Hawaiian/Pacific Islander girls are suspended at 7.85 times our rate of enrollment. That’s outrageous! Also outrageous is the fact that Black girls are 16.8% of all girls suspended in my school district, even though they make up just 5.6% of girls enrolled.
Curious to see if – and by how much – your school district disproportionately disciplines girls of color? Here’s how:
1. Head to our District Map
- If you’re a visual learner like I am, this district map makes a clear statement: many districts have some explaining to do when it comes to how frequently they suspend girls of color.
2. Click the magnifying glass icon in the top left corner
- Simply type in the city and state where you went to school.
3. Find your school district
- Hover over the different areas and find your district, or you can search your school district directly.
- This is also a great way to see how other districts in your area measure up.
4. Prepare to be shocked
- You can view the overall suspension rates for girls of color overall vs. their white peers in your area.
5. Determine if your school is doing right by girls of color
- The drop-down menu to the bottom right breaks it down even further! You can view the suspension rates of Black, Latina, Native Hawaiian/Pacific Islander girls in comparison to white girls.
Once you see the results, speak up and speak out. We need to raise awareness of this problem in order to motivate policymakers, as well our schools and district leaders, to solve it. The data speaks for itself, but it’s up to us to speak up for girls of color.