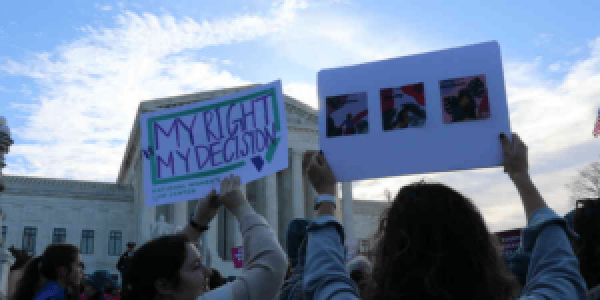
Abortion rights, women of color, and LGBTQI+ people are under attack. Pledge to join us in fighting for gender justice.

Wage Gap in 2022:
- Women working full time, year round were paid just 84 cents for every dollar paid to men in 2022, unchanged from the previous year. This calculation compares women of all races/ethnicities and men of all races/ethnicities.
- The wage gap for full-time, year-round workers was even worse for some women by race/ethnicity:
- Black women working full time, year round were paid just 69 cents for every dollar paid to white, non-Hispanic men.
- Latina women working full time, year round were paid just 57 cents for every dollar paid to white, non-Hispanic men.
- Native women working full time, year round were paid just 59 cents for every dollar paid to white, non-Hispanic men.
- White, non-Hispanic women working full time, year round were paid just 80 cents for every dollar paid to white, non-Hispanic men.
- When part-time and part-year workers are included, the wage gap is even larger, with women being paid just 78 cents for every dollar paid to men in 2022. Again, this calculation compares women of all races/ethnicities to men of all races/ethnicities.
- The wage gap among all working women and men, including part-time and part-year workers, was even worse for some women by race/ethnicity:
- Including part-time and part-year workers, Black women were paid just 66 cents for every dollar paid to working white, non-Hispanic men.
- Including part-time and part-year workers, Latinas were paid 52 cents for every dollar paid to working white, non-Hispanic men.
- Including part-time and part-year workers, Native women were paid 55 cents for every dollar paid to working white, non-Hispanic men.
- Including part-time and part-year workers, white, non-Hispanic women were paid just 74 cents for every dollar paid to working white, non-Hispanic men.
*** The wage gaps for Native women were calculated using the American Community Survey 1-year data. The wage gaps for all other groups were calculated using the Current Population Survey Annual Social and Economic Supplement (ASEC) data from the U.S. Census Bureau.
*** Wage gap data is not yet available for Asian American, Native Hawaiian, and Pacific Islander (AANHPI) women and Native women, which is calculated using annual 1-year American Community Survey microdata from the U.S. Census Bureau and has not yet been released.
Poverty in 2022:
- Poverty rates for women and girls as measured by the supplemental poverty measure (SPM) increased from 7.9 percent in 2021 to 12.8 percent in 2022, largely reflecting the lapse of the expanded Child Tax Credit and expiration of stimulus payments.
- 12.5 percent of women and girls lived in poverty as measured by the official poverty measure (OPM) in 2022, similar to 12.6 percent in 2021.
- Using the Census Bureau’s official poverty measure (OPM):
- Over 15.5 million women 18 and older, or more than 1 in 9, lived in poverty in 2022.
- Poverty rates were worse for many women of color: 16.6% percent of Black women and 16.8% percent of Latina women were in poverty last year as compared to 7.3 percent of white, non-Hispanic men.
- Nearly 11 million children, or over 1 in 7, lived in poverty in 2022.
- Poverty rates were worse for many children of color: 22.3 percent of Black children and 21.7 percent of Latinx children were in poverty last year.
- Over 3 in 10 families headed by women with children were poor in 2022.
- Nearly 6 in 10 poor children lived in a household headed by single women last year.
- Women made up 6 in 10 seniors who lived in poverty last year, with the poverty rate for senior women remaining high at 11.2 percent.
- In 2022, critical programs and expanded benefits kept millions of people out of poverty:
- Unemployment insurance lifted 0.4 million people out of poverty, which is significantly fewer than the 2.3 million it lifted out of poverty in 2021.
- Refundable tax credits lifted 6.4 million people out of poverty, which is significantly fewer than the 9.6 million they lifted out of poverty in 2021.
- Housing subsidies lifted 2.6 million people out of poverty, compared to 2.4 million in 2021.
- The Supplemental Nutrition Assistance Program, or food stamps, kept 3.7 million people above the poverty line, compared to 2.8 million in 2021.
- Social Security lifted 28.9 million people above the poverty line, compared to 26.3 million in 2021.
*** The official poverty measure (OPM) reported by the Census Bureau measures the percentage of the U.S. population with total income below the federal poverty threshold for their family size. “Income” is calculated before taxes and includes only cash income, such as earnings, pension and retirement income, investment income, Social Security, public assistance (cash), unemployment benefits, workers’ compensation, veterans’ payments, and alimony and child support payments.
*** The supplemental poverty measure (SPM) extends the official poverty measure partly by incorporating the value of several federal and state benefits that help support low-income families but are not counted as income under the official poverty measure (e.g. SNAP benefits, Earned Income Tax Credit, Child Tax Credit, Child and Dependent Care Credit), minus nondiscretionary expenses (e.g., taxes, work and medical expenses). In 2021, the SPM also includes the third round of economic impact payments, which lifted 8.9 million people above the poverty line last year.
Health Insurance Coverage in 2022:
- 93.2 percent of women and girls had some form of health insurance coverage in 2022. Over 11.3 million women and girls remained uninsured.
- The share of people without health insurance coverage declined from 13.3 percent in 2013 (before the Affordable Care Act fully took effect) to 7.9 percent in 2022, reaching a historic low.
- However, nearly 1 in 10 women of reproductive age (19-54) were uninsured in 2022, meaning more than 7.6 million were without coverage last year.
- Uninsurance rates varied significantly by race/ethnicity, underscoring the importance of policies that address the specific barriers Latinx and Black women experience when seeking health insurance coverage:
- Latinx women and girls (15 percent) were over 3 times more likely than white, non-Hispanic women and girls (4.3 percent) to be without insurance in 2022.
- 6.5 percent of Black women and girls were uninsured last year, along with 6 percent of Asian women and girls.
***The Census Bureau only counts individuals as uninsured in 2022 if they did not have insurance for all 12 months. This means some people may have been without health insurance for part of the year, and they are not counted among the uninsured. As a result, uninsurance rates for 2022 may be underestimated.
***The Census Bureau health insurance data is not available before 1999 and all historical comparisons are between 1999 and 2022.