Help Us Fight Back Against Efforts to Roll Back Gender Justice
Extremist judges will not stop endangering the lives of pregnant people or people who may become pregnant—overturning Roe v. Wade, attacking medication abortion, threatening the future of IVF, and this week at SCOTUS, emergency abortion care.
Our lawyers are waging strategic fights that make clear what is at stake for people who can become pregnant and seek to bolster our fundamental rights to control our lives, futures, and destinies.
Make a donation to the National Women’s Law Center to power the fight for accessible health care and a better future for all. Every donation is 100% tax-deductible.
Year in Review: How Women Fared in the Workforce in 2017
The beginning of the year is always a good time for self-reflection, goal-setting, and looking back on the highs and lows of the previous year. For policy analysts and women’s advocates, the recent release of December’s unemployment numbers provides an opportunity to look back on how women fared in the workforce during Trump’s first year as President.
A brief review of December’s numbers shows that there’s good news and bad news. Overall, the unemployment rate held steady at 4.1 percent from the previous month (good news!), but women of color continued to experience higher rates of unemployment than white men (bad news). And while 148,000 jobs were added to the economy last month (this is good!), less than a third of them went to women (very bad).
So, how does December stack up to the rest of 2017? We broke down our analysis based on a few lingering questions that will shape our advocacy work as we move into 2018: (1) How did unemployment change for women and women of color throughout 2017? (2) How many new jobs actually went to women workers in 2017? (3) What kinds of jobs did women get in 2017? These questions help us assess some of the aspects of the economy that affect the livelihoods of women and their families and will inform policy initiatives in the new year.
Okay, so let’s find out what happened:
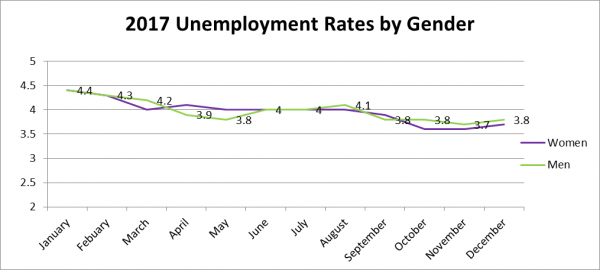
The first chart shows that the unemployment rate remained relatively low overall for women and men in 2017. The overall rates are something to celebrate but do not tell the complete story.
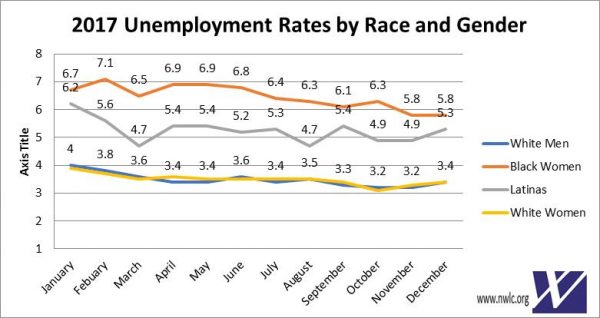
The chart below illustrates changes in unemployment rates by race and gender over the course of 2017. Unemployment for white men remained relatively stable between 3.2 and 4 percent and white women experienced similarly stable unemployment. However, women of color experienced higher unemployment and much more variation. For example, Black women saw spikes in unemployment during February and October, while Latina women saw dips in unemployment during March and August. These drops and spikes point to the relative insecurity of women’s jobs from month to month.
Source: Bureau of Labor Statistics (BLS). November and December numbers are preliminary.
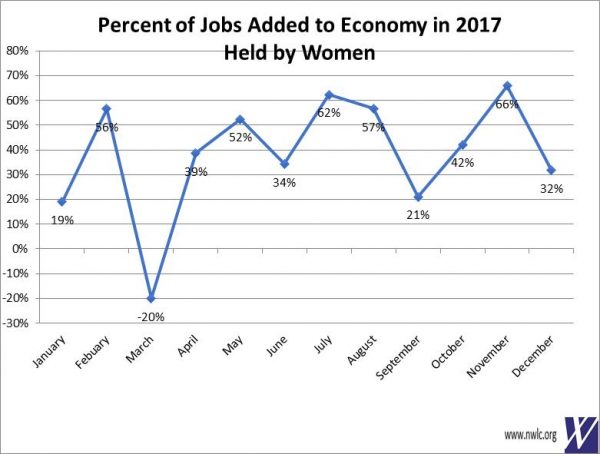
The third chart shows just how new many jobs actually went to women each month. While President Trump boasts of a “roaring” economy, men are primarily the ones benefiting. In total, 2,055,000 jobs were added to the economy in 2017 and 44 percent of them went to women. Women did the best in February, May, July, August and November. In other months, as the chart shows, women lost jobs (March) or gained very small percentage of jobs (September).
Source: Bureau of Labor Statistics (BLS). November and December numbers are preliminary.
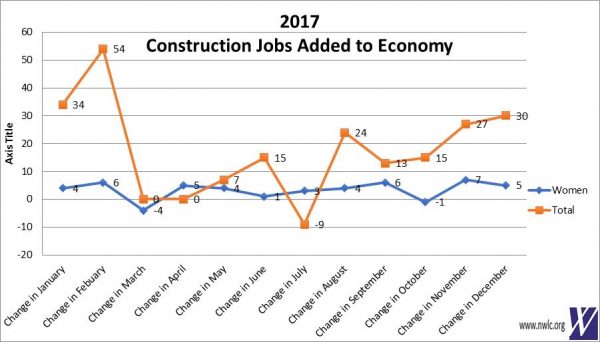
The next two charts show two industry sectors that have something surprising or interesting to say about women workers. For example, many people see construction as a male-dominated industry, and, unfortunately, they’re right—but not because women shy away from manual labor or don’t want to get their hands dirty. In fact, the underrepresentation of women—and women of color more specifically—has more to do with discriminatory practices like sexual harassment and lack of mentorship opportunities that prevent women from entering high-paying construction jobs. With this in mind, the chart below shows how women fared in 2017. As you can see, the orange line mapping overall additions and losses is very dynamic while the blue line representing women stayed fairly stagnant, showing little growth. For example, in December, construction saw employment gains but women’s share of those gains dropped. It looks like there’s more work to do in 2018 to get more women jobs in this industry.
Source: Bureau of Labor Statistics (BLS). Numbers in thousands. November and December numbers are preliminary.
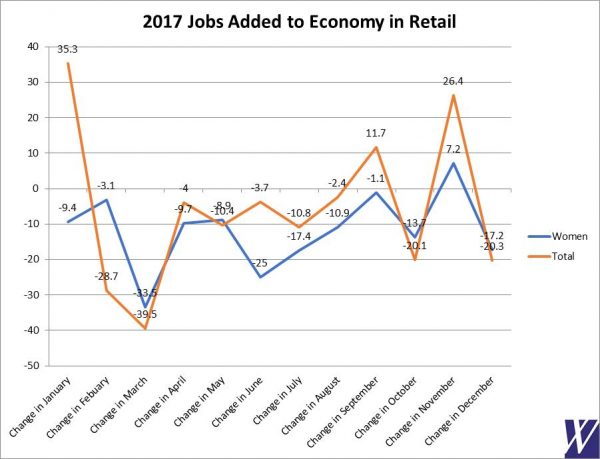
Another industry that underwent a lot of change in 2017 was retail. Many journalists lamented the death of retail in articles like this and this, and, certainly, there has been a shift in how people shop (doing more shopping online, for example). This consumer shift has a direct effect on the future of women’s jobs, since more women than men hold low-wage retail jobs like cashiers.
As illustrated by the chart below, there are stark differences between the number of total jobs added to the retail sector and how many of those jobs went to women in January, September, and November. And even in months were retail jobs were added, women didn’t see their fair share. This holiday season saw a loss of 20,000 retail jobs, which is striking because we usually see gains during this time due to seasonal and part-time jobs added to help with the holiday rush.
Source: Bureau of Labor Statistics (BLS). Numbers in thousands. November and December numbers are preliminary.
With this information, take President Trump’s bragging with a grain of salt. If nothing else, this year in review shows us that women, especially women of color, workers still lag terribly behind. Politicians, policy makers, and industry leaders still have work to do in order to provide working women with equal economic footing, whether that’s providing apprenticeships to help women break into male-dominated and/or higher-paying industries; creating policies that prevent sexual harassment and ensure women are paid the same as their male counterparts; or making sure that women workers have fair schedules that allow them to arrange for child care and meet their responsibilities at home and on the job.